Introduction:
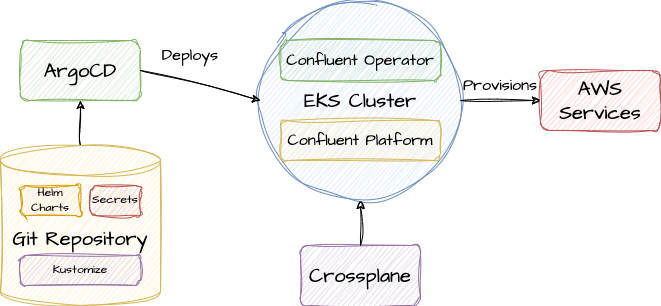
When designing any software system, it’s essential to understand what a software architecture diagram should include. These diagrams provide a comprehensive overview of all components, such as services, databases, and APIs, and how they interact within the system. By visualizing this information, developers, engineers, and stakeholders can ensure everyone shares a clear understanding of the system’s structure, behavior, and interdependencies. In this post, we’ll break down what a software architecture diagram typically looks like and explain how Draft1.ai simplifies the process by generating these diagrams automatically based on text inputs.
1. The Anatomy of a Software Architecture Diagram
A well-structured software architecture diagram typically consists of several critical elements. These elements provide a snapshot of the system’s internal structure, showing how the different parts of the application interact and communicate.
Core Components of a Software Architecture Diagram:
- Services: The independent functional units within the system, such as microservices in a microservices architecture.
- Databases: The data storage systems, such as relational or NoSQL databases, which store and retrieve application data.
- APIs: The communication protocols that allow different services to interact with each other or with external systems.
- External Dependencies: Any external systems or third-party services that the application interacts with, such as payment gateways, authentication services, or external data providers.
Draft1.ai allows you to generate a software architecture diagram by simply describing these elements in a sentence. For instance, you can input "a three-tier web application with a frontend, backend, and database" and the platform will create a detailed diagram illustrating the components and their interactions.
Key Points:
- Diagrams should include core components like services, databases, communication protocols (e.g., APIs), and any external systems.
- Draft1.ai can automatically generate a comprehensive architecture diagram based on your text-based input, ensuring all critical components are included.

2. How to Visualize Data Flow and Interactions in Software Architecture Diagrams
An effective software architecture diagram doesn’t just show static components but also illustrates the data flow between these components. Draft1.ai generates diagrams that map out these interactions, giving you a visual representation of how data is transmitted across services, databases, and external APIs.
Data Flow Considerations in Architecture Diagrams:
- Request-Response Flows: Showing how user requests move through the system, typically from the frontend to the backend, and how the backend responds.
- Internal Communication: For example, how microservices communicate via APIs or message queues.
- External Communication: Visualizing communication with third-party services, such as payment processors or external data sources.
By using Draft1.ai, you can visualize these flows by simply describing them in your input. For instance, entering "an e-commerce platform where users request product details from the frontend, and the backend fetches the information from a database" will result in a diagram that shows each layer's interaction.
Key Points:
- Illustrating data flow between the system’s components provides insight into how information is transmitted and where potential bottlenecks or failures could occur.
- Draft1.ai visualizes these flows automatically, ensuring that the diagram captures all critical interactions.

3. Automating the Process with Draft1.ai
Creating these diagrams manually can take hours, if not days, especially for complex systems. Draft1.ai significantly reduces this time by automatically generating detailed software architecture diagrams in seconds. Just describe your system’s architecture in plain text, and the AI does the heavy lifting for you, generating a fully customizable diagram that includes all the key elements.
For example, by inputting "a SaaS platform with a load balancer, microservices, and a cloud database," Draft1.ai generates a detailed, visual diagram that outlines each component's role and how they interact. You can then further refine the diagram by adding specific details or adjusting the layout, ensuring it meets your exact needs.
Key Points:
- Draft1.ai automates the generation of software architecture diagrams, saving significant time and effort.
- By following industry standards and best practices, Draft1.ai ensures your diagrams are scalable, secure, and up to date.
- The diagrams can be easily customized to fit specific project requirements or modified as the architecture evolves.

4. Best Practices for Software Architecture Diagrams
Even though Draft1.ai automates much of the work, it’s essential to follow best practices when designing and reviewing your software architecture diagrams. Ensuring that the architecture is scalable, secure, and maintainable is crucial for long-term system success. Here are some tips to keep in mind when using Draft1.ai:
Best Practices:
- Scalability: Ensure that components such as databases and services can handle increased load as the application grows. Draft1.ai includes load balancers and horizontally scalable services in its diagrams.
- Security: Integrate secure communication protocols, such as HTTPS, and ensure external APIs are secured with proper authentication.
- Simplicity: Keep diagrams easy to understand, focusing on high-level architecture rather than detailed implementation unless required.
Key Points:
- Draft1.ai automatically incorporates best practices like load balancing, scalability, and secure communication into the generated diagrams.
- You can further refine and customize the diagram to include specific security measures, scalability strategies, or optimization techniques.
Related Posts:
- How to Create a Software Architecture Diagram with AI : Best Practices for Automation – A deeper look at automating architecture diagrams.
- AI Architecture Generator : Revolutionizing the Way We Design Software and Systems – Learn how AI is changing system design.
- Using GPT to Automatically Generate Diagrams : A Step -by -Step Guide – Discover the power of GPT in diagram generation.
