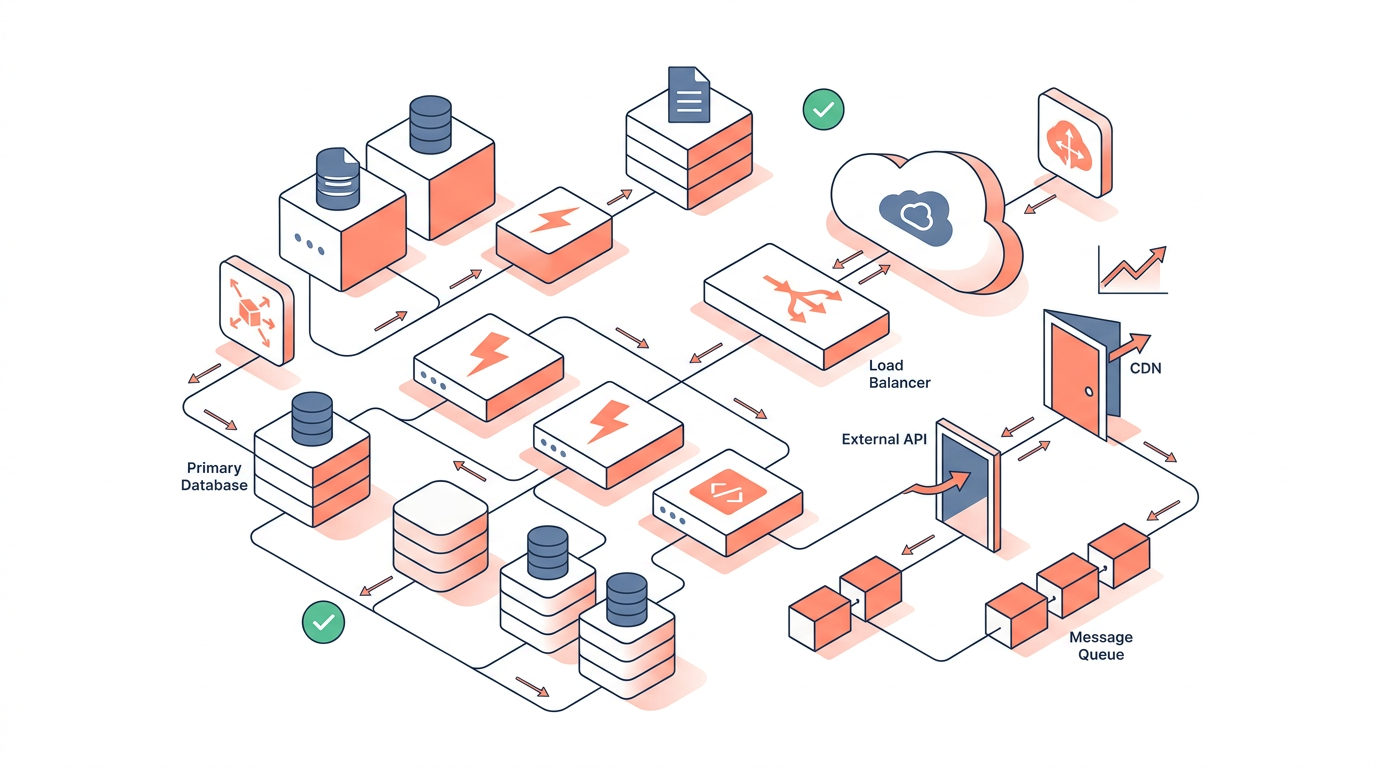
A strong system design diagram communicates [architecture](https://www.draft1.ai/blog/serverless-architecture-patterns-every-engineer-should-know-in-2026) decisions instantly — and in a system design interview, that visual clarity is often what separates a hire from a no-hire. Interviewers at companies like Google, Meta, Amazon, and Stripe spend roughly 45–60 minutes evaluating not just what you know, but how clearly you can translate requirements into a working system. The diagram you draw is the primary artifact they walk away with.
This article covers exactly what interviewers look for when you sketch a system design diagram, which notation conventions to follow, how to represent core building blocks like load balancers, caches, and message queues, and a worked example you can adapt for common interview questions. Whether you're preparing for a senior engineer role or brushing up on how to draw system design diagrams that hold up under scrutiny, this guide gives you a concrete framework.
What Interviewers Actually Look For
Interviewers evaluate your diagram for structured thinking, not artistic polish — they want to see that you understand data flow, failure modes, and scalability trade-offs. A whiteboard sketch that shows a single box labeled "backend" tells them almost nothing. A diagram that shows an API Gateway routing to two separate microservices, each backed by a read replica, tells them you've thought about real operational concerns.
The four things most interviewers score explicitly are:
- Clarity of data flow — Can they trace a request from client to storage and back?
- Component justification — Do you explain why each box exists?
- Scalability signals — Are there horizontal scaling points, caches, or async paths?
- Failure awareness — Are there single points of failure, and do you acknowledge them?
A common mistake is drawing components without labeling the connections. Every arrow should carry at minimum a protocol or data type: HTTPS, gRPC, Kafka topic: order-events, SQL read. Unlabeled arrows force the interviewer to ask clarifying questions, which costs you time and signals uncertainty.
Notation Conventions That Read Instantly
There is no single mandatory notation for system design interviews, but consistent, readable symbols matter far more than formal correctness. Most interviewers have internalized a loose shared vocabulary from years of whiteboarding. Deviating from it without explanation creates friction.
Use these conventions as defaults:
- Rectangles → services, servers, or microservices
- Cylinders → databases or persistent storage
- Parallelograms or stacked rectangles → caches (Redis, ElastiCache)
- Hexagons or envelope icons → message queues or event buses (SQS, Kafka, SNS)
- Cloud outline or rounded rectangle → CDN or external network boundary
- Diamond → load balancer or API gateway
- Dashed borders → availability zone or VPC boundary
Label every box with both the logical role and the technology choice: User DB (Aurora PostgreSQL) is better than just DB. This shows you can map abstract architecture to real AWS services, which matters in 2026 when interviewers increasingly expect familiarity with managed services rather than bare-metal thinking.
Keep your diagram layered: clients at the top, storage at the bottom, and processing in the middle. This top-to-bottom convention matches how most engineers mentally trace a request, so the interviewer can follow along without reorientation.
Core Building Blocks and How to Draw Them
Every scalable system design diagram is built from a small set of recurring components — master these six and you can sketch most interview scenarios. Here is how to represent each one accurately.
Load Balancers
Draw a diamond or triangle labeled with the type: Layer 4 (TCP/UDP) or Layer 7 (HTTP/HTTPS). In AWS terms, an Application Load Balancer (ALB) operates at Layer 7 and can route based on path or host headers; a Network Load Balancer (NLB) operates at Layer 4 with sub-millisecond latency. Always note whether the load balancer is internet-facing or internal. Add a small annotation like ALB — path-based routing so the interviewer knows you understand the distinction.
Caches
Draw a stacked-rectangle shape and label it with the cache tier: L1 (in-process), L2 (distributed, e.g., ElastiCache for Redis), or CDN edge cache (CloudFront). Annotate the TTL if relevant and note the eviction policy (LRU, LFU). A cache without a stated invalidation strategy is a red flag to experienced interviewers — add a small note like write-through or cache-aside next to the arrow.
Message Queues and Event Buses
Draw a hexagon or envelope and label it with the service and topic/queue name: SQS FIFO — payment-requests or Kafka — user-events. Annotate the consumer group and whether processing is at-least-once or exactly-once. Show the producer on the left, the queue in the middle, and the consumer service on the right. This pattern immediately signals that you understand async decoupling and backpressure handling.
Databases
Use a cylinder and always specify: relational vs. NoSQL, primary vs. read replica, and sharding strategy if applicable. Aurora MySQL (primary + 2 read replicas, Multi-AZ) is a complete label. If you're using DynamoDB, note the partition key choice — interviewers will probe this.
API Gateway
Draw a rectangle at the top of the diagram, just below the client layer. Label it API Gateway (AWS API Gateway / Kong) and annotate the responsibilities it handles: rate limiting, auth (JWT/OAuth 2.0), request routing. This prevents you from having to explain those concerns inside every downstream service box.
CDN
Draw a cloud outline at the very top, before the API Gateway, and label it CDN (CloudFront). Annotate the origin it points to and the cache behaviors (e.g., static assets: 24h TTL, API responses: no-cache).
Comparison: Common System Design Components at a Glance

| Component | AWS Service | Primary Role | Key Limit / Consideration |
|---|---|---|---|
| Layer 7 Load Balancer | ALB | HTTP routing, SSL termination | 100 rules per listener |
| Layer 4 Load Balancer | NLB | TCP/UDP, ultra-low latency | Static IP per AZ |
| Distributed Cache | ElastiCache (Redis) | Read offload, session store | Max 500 GB per node (r7g.16xl) |
| Message Queue | SQS Standard | Async decoupling | At-least-once, best-effort order |
| FIFO Queue | SQS FIFO | Ordered, exactly-once | 3,000 msg/s with batching |
| Event Streaming | MSK (Kafka) | High-throughput event bus | Retention configurable, replay |
| Relational DB | Aurora PostgreSQL | ACID transactions | 15 read replicas per cluster |
| NoSQL DB | DynamoDB | Key-value, low-latency reads | 400 KB max item size |
Worked Example: URL Shortener at Scale
A URL shortener is one of the most common system design interview questions, and it exercises every major diagram component cleanly. Here is how to draw it step by step.
Step 1 — Establish scope. Write the requirements in the corner of the whiteboard: 100M URLs created per day, 10B redirects per day, 99.99% availability, <50ms p99 redirect latency. This anchors every subsequent decision.
Step 2 — Draw the client and CDN. Start with a browser/mobile client at the top. Draw a CloudFront CDN below it. Annotate: static assets cached at edge; redirect responses not cached.
Step 3 — Add the API Gateway. Below CloudFront, draw an API Gateway box. Label it: rate limiting: 1,000 req/s per IP; JWT auth for write endpoints.
Step 4 — Split read and write paths. This is where many candidates lose points by drawing a single "backend" box. Instead, draw two separate service boxes:
- Write Service — handles POST /shorten, generates a 7-character Base62 ID, writes to the primary DB.
- Redirect Service — handles GET /{shortCode}, checks cache first, then DB.
Connect both to an ALB sitting between the API Gateway and the services.
Step 5 — Add the cache. Draw an ElastiCache (Redis) cylinder next to the Redirect Service. Annotate: cache-aside pattern; TTL 24h; ~90% cache hit rate expected. This single component absorbs the vast majority of the 10B daily redirects.
Step 6 — Add the database. Draw an Aurora PostgreSQL cylinder below the Write Service. Add a read replica connected to the Redirect Service for cache misses. Annotate: primary: writes only; replica: reads on cache miss.
Step 7 — Add async analytics. Draw an SQS Standard queue receiving events from the Redirect Service. Connect it to an Analytics Consumer service that writes to S3 and then to Athena. This shows you understand that analytics writes should never be on the hot path.
Step 8 — Draw AZ boundaries. Wrap the services and DB in dashed boxes labeled us-east-1a and us-east-1b. This signals Multi-AZ awareness without requiring a lengthy verbal explanation.
The final diagram has roughly 12 labeled boxes and 15 labeled arrows — complex enough to show depth, simple enough to draw in 20 minutes.
Key Takeaways
- Label every arrow with a protocol, data format, or topic name — unlabeled connections are the most common diagram mistake in system design interviews.
- Split read and write paths early; it signals scalability thinking and opens the door to discussing caching and replication naturally.
- Use real service names (ALB, ElastiCache, SQS FIFO, Aurora) rather than generic labels — it demonstrates operational familiarity.
- Annotate trade-offs inline, not just verbally: write
at-least-oncenext to a queue,cache-asidenext to a cache,Multi-AZnext to a database. - Draw AZ and VPC boundaries with dashed lines — interviewers at senior levels expect you to think about failure domains, not just happy-path flows.
- Scope before you draw: write requirements and back-of-envelope numbers in the corner first; every component choice should trace back to a stated constraint.
- Separate the analytics path from the transactional path using async queues — this is a high-signal move that many candidates miss.
Frequently Asked Questions
How detailed should a system design diagram be in an interview?
Aim for 10–15 labeled components with annotated connections — detailed enough to show depth, simple enough to draw in 20 minutes. If your diagram takes longer than 25 minutes to sketch, you're over-engineering it for the interview context and leaving no time for discussion.
Should I use formal UML notation in a system design interview?
No — UML is rarely expected and can slow you down. Interviewers in 2026 expect the informal but consistent whiteboard vocabulary described above (rectangles, cylinders, hexagons) rather than strict UML component or deployment diagrams.
What is the biggest diagramming mistake candidates make?
Drawing a single monolithic "backend" box is the most common error. It signals that you haven't thought about how components scale independently, fail independently, or communicate asynchronously.
How do I show scalability in a system design diagram?
Add explicit horizontal scaling indicators: draw multiple instances of a service box, show a load balancer in front of them, and annotate with auto-scaling group or ECS service: min 2, max 20 tasks. Caches and read replicas are also strong scalability signals.
How should I handle databases in a system design diagram?
Always specify the database type (relational vs. NoSQL), the access pattern (read-heavy vs. write-heavy), and the replication topology (primary/replica, Multi-AZ). Leaving a database as a single unlabeled cylinder is a missed opportunity to demonstrate depth.
Can I use tools like draw1.ai or Excalidraw in virtual interviews?
Yes — many companies now allow or even encourage digital diagramming tools in virtual interviews. If you use one, practice beforehand so tool mechanics don't slow you down. The same notation and labeling rules apply regardless of medium.
How do I draw message queues correctly in a system design diagram?
Draw the queue as a distinct component between the producer service and the consumer service, label it with the technology and topic name, and annotate the delivery guarantee (at-least-once for SQS Standard, exactly-once for SQS FIFO). Always show the consumer reading from the queue rather than the queue pushing to the consumer — this accurately reflects the pull-based model of SQS and Kafka consumers.
Draw this in seconds with draft1. Describe your architecture in plain English and draft1 generates an editable AWS/cloud diagram plus documentation — no dragging boxes around. Try it free.