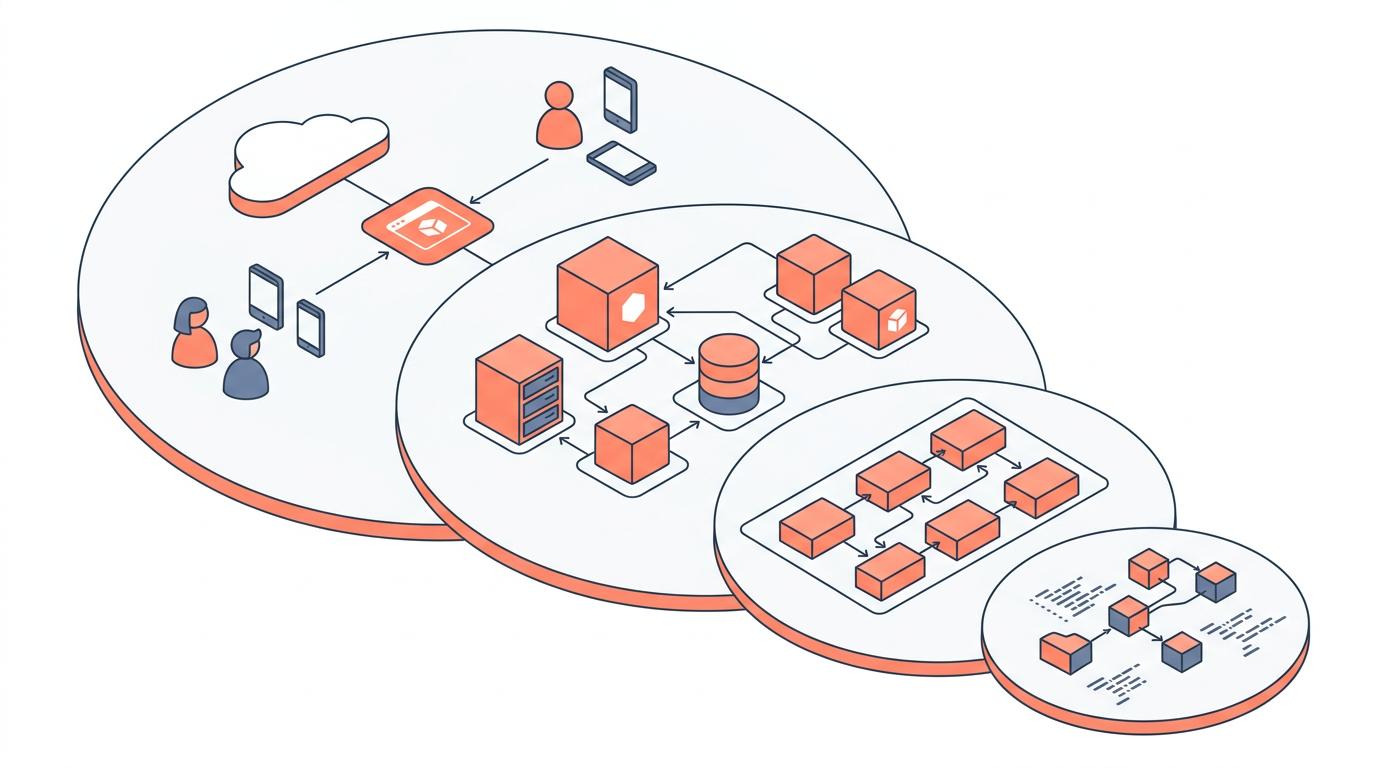
The C4 model is a hierarchical framework for creating software [architecture](https://www.draft1.ai/blog/event-driven-architecture-on-aws-a-practical-guide-to-eventbridge-sqs-and-sns) diagrams at four levels of abstraction — Context, Container, Component, and Code — so that different audiences get exactly the detail they need. Invented by Simon Brown and widely adopted since 2018, it solves one of the most persistent problems in software engineering: architecture diagrams that are either too vague to be useful or too detailed to be understood. In this article you will learn what each level means, when to use it, how to apply it to a real system, and how tools like draft1.ai can generate these diagrams from plain-language descriptions.
What Is the C4 Model and Why Does It Matter?
The C4 model gives every stakeholder a map drawn at the right zoom level, much like how a city planner, a building architect, and an electrician all need different views of the same structure. Before C4, teams typically produced one sprawling diagram that tried to show everything — boxes connected by unlabeled arrows, no consistent notation, and no shared vocabulary. The result was diagrams that aged badly and confused more than they clarified.
C4 borrows the concept of zoom levels from cartography. You start at 30,000 feet (the Context diagram) and drill down only as far as the conversation requires. This means a CTO can review a Context diagram in a five-minute meeting, while a backend engineer can study a Component diagram during a sprint planning session — both using the same model, just different views.
The model is notation-agnostic. You can draw C4 diagrams with boxes and arrows in any tool, encode them in Structurizr DSL, render them with PlantUML, or generate them automatically from a natural-language prompt in draft1.ai. What matters is the hierarchy and the vocabulary, not the drawing tool.
The Four Levels Explained
Each C4 level answers a specific question about the system, and choosing the wrong level for an audience is as harmful as having no diagram at all.
Level 1 — System Context Diagram
The Context diagram answers: What does this system do, and who uses it? It shows your software system as a single box in the center, surrounded by the people (users, personas) and external systems it interacts with. There are no technology choices here — no mention of databases, programming languages, or cloud services.
When to use it: - Onboarding new team members or stakeholders - Scoping a project or a change request - Executive or product-owner reviews
A Context diagram for an e-commerce platform might show: a Customer actor, an Admin actor, the E-Commerce Platform box, and external systems such as Stripe (payment), SendGrid (email), and Shopify Inventory API. That is the entire diagram. Its power is in what it omits.
Level 2 — Container Diagram
The Container diagram answers: What are the high-level technical building blocks, and how do they communicate? A container in C4 is not a Docker container — it is any separately deployable or runnable unit: a web application, a mobile app, a REST API, a message queue, a database, a serverless function. Each container runs in its own process space.
When to use it: - Sprint planning and architecture reviews - Deciding on deployment topology - Discussing technology choices with engineers
For the same e-commerce platform, the Container diagram might reveal: a React SPA (served from CloudFront), a Node.js API (running on ECS Fargate, port 443/HTTPS), a PostgreSQL database (Amazon RDS, port 5432), an SQS queue for order events, and a Python Lambda for order processing. Arrows are labeled with protocols and data descriptions: "Reads/writes order data [HTTPS/REST]."
Level 3 — Component Diagram
The Component diagram answers: What are the major logical building blocks inside a single container? A component maps roughly to a module, service class, controller, or bounded context within one container. You create one Component diagram per container that warrants the detail.
When to use it: - Detailed design sessions with the engineering team - Code review and refactoring discussions - Documenting a complex microservice internally
Inside the Node.js API container you might show: an Order Controller (handles POST /orders), an Order Service (business logic), a Payment Gateway Client (calls Stripe), a Repository (wraps RDS queries), and an Event Publisher (puts messages on SQS). Each component is a real, named piece of code — not a vague concept.
Level 4 — Code Diagram
The Code level answers: How is a specific component implemented? This is typically a UML class diagram or an entity-relationship diagram for a database schema. Simon Brown himself recommends generating these automatically from code (e.g., with IDE plugins) rather than maintaining them by hand, because they go stale fastest.
When to use it: - Explaining a non-obvious design pattern to a new contributor - Documenting a complex algorithm or data model - Code review for a critical, long-lived module
In practice, most teams skip hand-drawn Level 4 diagrams entirely and rely on IDE tooling or auto-generated docs. The value of C4 is concentrated in Levels 1–3.
Comparing the Four C4 Levels at a Glance
| Level | Name | Primary Audience | Shows | Typical Update Frequency |
|---|---|---|---|---|
| 1 | Context | Executives, PMs, all engineers | System + actors + external systems | Rarely (major scope changes) |
| 2 | Container | Architects, senior engineers | Deployable units + protocols | Per quarter or major release |
| 3 | Component | Engineering team | Modules inside one container | Per sprint or feature |
| 4 | Code | Individual developers | Classes, interfaces, DB schema | Continuously (auto-generated) |
C4 vs. Other Diagramming Approaches
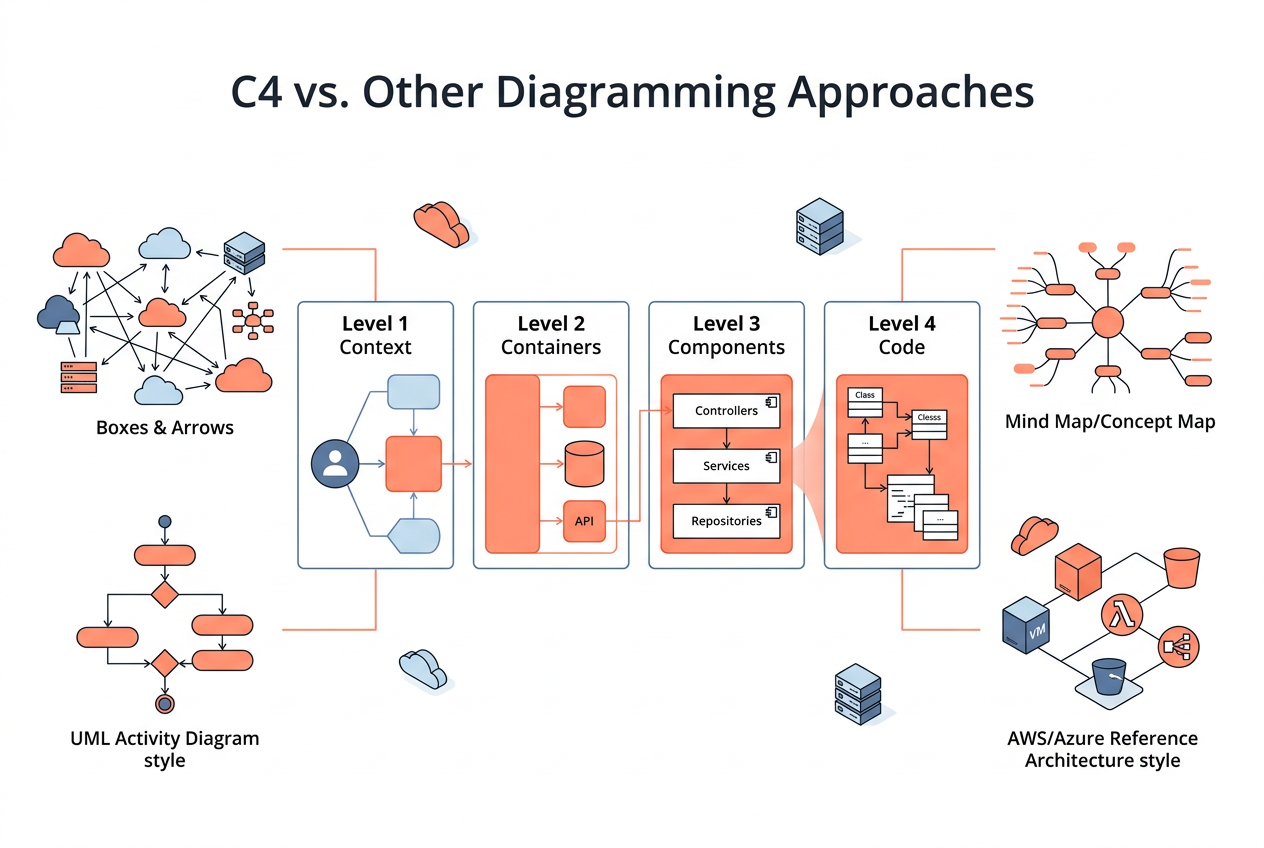
C4 is not the only architecture notation, but it is the most accessible for modern software teams because it requires no UML training and scales from a whiteboard sketch to a living document in code.
| Approach | Learning Curve | Audience Fit | Tool Dependency | Living Docs Support |
|---|---|---|---|---|
| C4 Model | Low | All levels | None (notation-agnostic) | Yes (Structurizr DSL) |
| UML (full) | High | Architects | Moderate | Partial |
| ArchiMate | Very high | Enterprise architects | High | Partial |
| Informal boxes/arrows | None | Anyone | None | No |
| AWS Architecture Icons | Medium | Cloud engineers | Moderate | No |
The key differentiator is audience fit across levels. UML is expressive but alienates non-technical stakeholders. Informal diagrams are fast but inconsistent. C4 sits in the middle: structured enough to be precise, simple enough for a product manager to read Level 1 without training.
A Practical Example: Diagramming a SaaS Analytics Platform
Imagine you are architecting a multi-tenant SaaS analytics product on AWS. Here is how C4 guides the conversation:
Level 1 (Context): Your system is AnalyticsHub. Actors are Data Analyst and Admin. External systems are Auth0 (identity), Snowflake (data warehouse), and Slack (alert notifications).
Level 2 (Container): Inside AnalyticsHub you have a Next.js frontend (CloudFront + S3), a GraphQL API (ECS Fargate, port 443), a Query Engine (Lambda, triggered by API), a Metadata Store (Amazon Aurora PostgreSQL, port 5432), and an Event Bus (Amazon EventBridge). The GraphQL API talks to the Query Engine via AWS SDK invoke; the Query Engine talks to Snowflake over JDBC/port 443.
Level 3 (Component — GraphQL API container): You show a Schema Registry, an Auth Middleware (validates Auth0 JWT), a Dashboard Resolver, a Report Resolver, a Tenant Isolation Filter (row-level security logic), and a Snowflake Client. Now a new engineer understands exactly where to add a new data source without reading 50,000 lines of code.
Level 4: Auto-generated from TypeScript interfaces using a VS Code plugin. No manual maintenance.
Using draft1.ai to Generate C4 Diagrams
One of the friction points with C4 has always been tooling. draft1.ai removes that friction by letting you describe your system in plain English and generating the appropriate C4 diagram level automatically. You might type:
"Create a C4 Container diagram for a ride-sharing app. Users interact with a React Native mobile app. The app calls a REST API on ECS Fargate. The API reads from a PostgreSQL RDS database and publishes ride events to an SNS topic. A Lambda function subscribes to SNS and sends push notifications via Firebase."
draft1.ai parses the intent, identifies containers and relationships, applies correct C4 notation, and outputs a diagram you can export or embed in Confluence. This is particularly valuable for teams that want living documentation without the overhead of learning Structurizr DSL from scratch.
Key Takeaways
- C4 stands for Context, Container, Component, and Code — four zoom levels that serve different audiences and different conversations.
- A Context diagram (Level 1) is the fastest way to align non-technical stakeholders on system scope; it should contain no technology details.
- A Container diagram (Level 2) is the workhorse of C4 — it captures deployable units, protocols, and ports, making it essential for architecture reviews and deployment planning.
- A Component diagram (Level 3) lives inside a single container and helps engineers navigate a codebase without reading all the source code.
- Level 4 (Code) diagrams are best auto-generated from source; hand-maintaining them is rarely worth the effort.
- C4 is notation-agnostic — you can use Structurizr DSL, PlantUML, Mermaid, or AI-powered tools like draft1.ai to produce compliant diagrams.
- The biggest mistake teams make is drawing one diagram for all audiences; C4's hierarchy exists precisely to prevent that.
Frequently Asked Questions
What does "container" mean in the C4 model?
In C4, a container is any separately deployable or runnable unit — a web app, API, database, message queue, or serverless function. It has nothing to do with Docker containers specifically, though a Docker container running a service would qualify as a C4 container.
Do I need to create all four levels for every system?
No. Most teams only need Levels 1 and 2 for high-level alignment, and Level 3 for complex or critical services. Level 4 is optional and is usually auto-generated rather than hand-drawn.
Is C4 compatible with Agile and DevOps workflows?
Yes. Because C4 diagrams can be stored as code (Structurizr DSL, Mermaid), they can live in a Git repository alongside application code, reviewed in pull requests, and updated as part of the Definition of Done. This makes them a natural fit for continuous delivery pipelines.
How is C4 different from UML?
C4 is a set of diagram types with a defined hierarchy and vocabulary; UML is a full modeling language with dozens of diagram types and formal semantics. C4 is far easier to learn and produces diagrams that non-technical stakeholders can read, whereas UML requires training and is often misused.
Can I use C4 for cloud-native and microservices architectures?
Absolutely — C4 is particularly well-suited to microservices because each microservice is a container at Level 2, and you can drill into any individual service with a Level 3 Component diagram without cluttering the overall picture.
What tools support the C4 model in 2026?
Popular options include Structurizr (the reference implementation by Simon Brown), PlantUML with the C4-PlantUML library, Mermaid's C4 diagram type, Lucidchart, and AI-powered generators like draft1.ai that produce C4 diagrams from natural-language prompts.
How often should C4 diagrams be updated?
Context diagrams change rarely — only when the system's scope or major external dependencies change. Container diagrams should be reviewed each quarter or at major releases. Component diagrams are best updated per sprint or feature. Treating diagrams as living documents in version control is the most reliable way to keep them accurate.
Draw this in seconds with draft1. Describe your architecture in plain English and draft1 generates an editable AWS/cloud diagram plus documentation — no dragging boxes around. Try it free.